Plotting programs
It's easy to produce GB's of data very quickly running simulations. You can use grep, awk and such tools to get out the parts of the data that are relevant, but often you will need to plot your results. Under linux, we have two convenient tools: gnuplot and xmgrace. Here you will learn the basic usage of gnuplot, but try xmgrace sometime for fancier plots.
Simple plotting with gnuplot
Gnuplot is a powerful and free plotting utility that is available for most architectures and operating systems.
Here is a data file (and a web version):
# Example1.dat
# number of subint.   - width of subinterval, computed value, abs. error
0 1			5		 0.00673794699908559
1 0.5			5.0009765625	 0.00576138449908559
2 0.25			5.00317121193893 0.00356673506015159
3 0.125			5.00478985229103 0.00194809470805701
4 0.0625		5.00572403277733 0.0010139142217529
5 0.03125		5.00622120456923 0.000516742429855555
6 0.015625		5.00647715291715 0.000260794081935245
7 0.0078125		5.00660694721608 0.000130999783004349
8 0.00390625		5.00667229679632 6.56502027673866e-05
9 0.001953125		5.0067050843668  3.28626322820824e-05
10 0.0009765625		5.0067215063061  1.64406929883398e-05
11 0.00048828125	5.00672972430911 8.22268997247022e-06
12 0.000244140625	5.00673383506831 4.11193077187733e-06
13 0.0001220703125	5.00673589088727 2.05611181058885e-06
14 6.103515625e-05	5.00673691890656 1.02809252577885e-06
15 3.0517578125e-05	5.00673743294363 5.14055459532869e-07
16 1.52587890625e-05	5.00673768996904 2.57030048800289e-07
17 7.62939453125e-06    5.00673781848355 1.28515534214557e-07
18 3.814697265625e-06   5.00673788274127 6.42578132925564e-08
19 1.9073486328125e-06  5.00673791487013 3.21289537197345e-08
20 9.5367431640625e-07  5.00673793093482 1.60642699142954e-08
21 4.76837158203125e-07 5.00673793896686 8.03222910406021e-09
We can now go ahead and use gnuplot.
At the command line type
gnuplot
You will see the prompt change to something
like
G N U P L O T
Linux version 3.7
patchlevel 1
last modified Fri Oct 22 18:00:00 BST 1999
Copyright(C) 1986 - 1993, 1998, 1999
Thomas Williams, Colin Kelley and many others
Type `help` to access the on-line reference manual
The gnuplot FAQ is available from
http://www.ucc.ie/gnuplot/gnuplot-faq.html
Send comments and requests for help to info-gnuplot@dartmouth.edu>
Send bugs, suggestions and mods to bug-gnuplot@dartmouth.edu>
Terminal type set to 'x11'
gnuplot
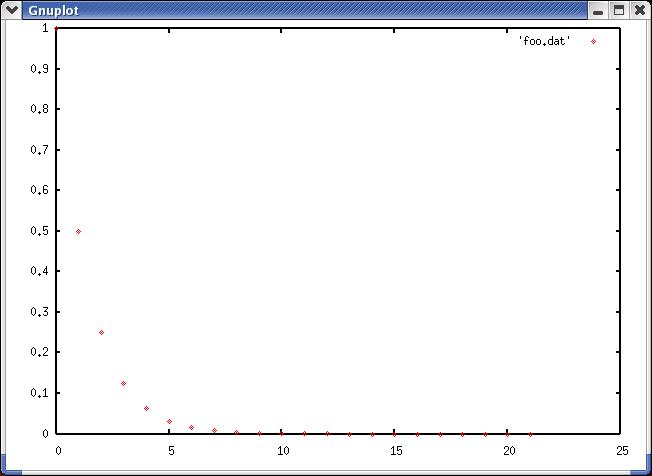
Now you are ready to make a plot. The first simple command is
gnuplot> plot 'foo.dat'
There is one problem and that is
the existence of text or other spurious information
at the top of your data file such as instructions
or other "headers." It is suggested that you keep this information in the file, but comment
them out using the pound sign #. Now you should
be looking at a window like the one below.
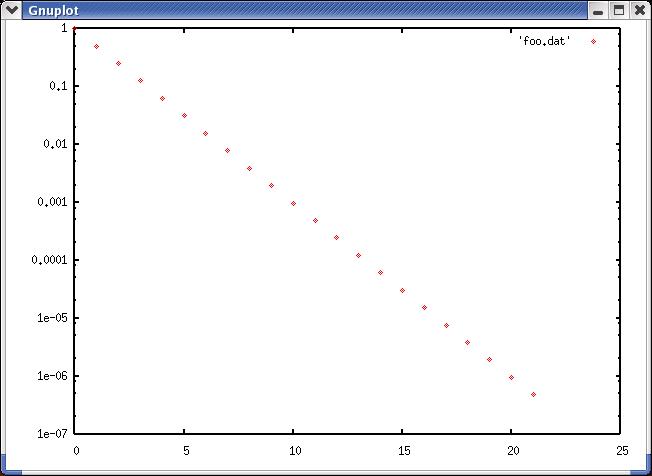
Fitting Data
This function looks exponential, so let's plot it with semi-log axes. Simply type
gnuplot> set logscale y
gnuplot> replot
and you should get something more linear
If you would like to fit this
data to an exponential form, you will need
to give gnuplot the functional
form that you would like to use to fit the data,
with some appropriate fitting parameters.
gnuplot> f(x) = a * exp (-x*b)
After giving gnuplot the form above, invoke the fitting function by
gnuplot> fit f(x) 'foo.dat' via a,b
After giving this command, you will receive a lot of output,
and near the end you will see your fit parameters:
Final set of parameters            Asymptotic Standard Error
=======================            ==========================

a               = 0.999999         +/- 1.104e-05    (0.001104%)
b               = 0.693145         +/- 1.482e-05    (0.002138%)
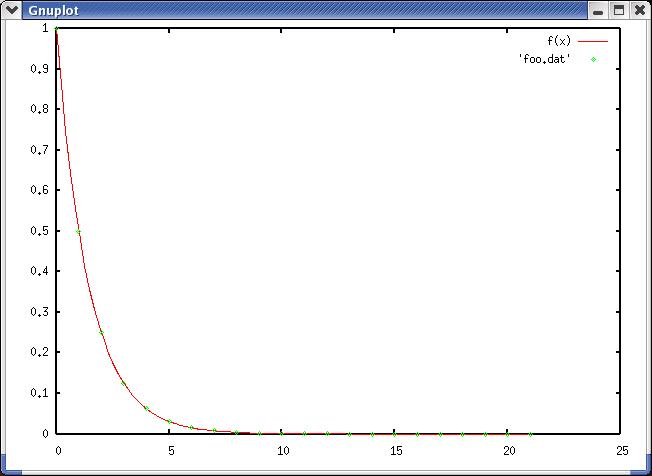
Once you have fit the data and are comfortable
with the amount of error (the error in this case is
about 10^-5), we can plot
the fit and the data together:
gnuplot> set nologscale
gnuplot> plot f(x), 'foo.dat'
Quantities plotted together are separated
by commas. Now we can see the quality of the fit
we have chosen.
Multiple data columns
Remember that our data had multiple columns. By default, gnuplot plotted column 1 vs. column 2, but we can control this using the command 'using x:y' where x and y refer to specific columns in the data.
Try these examples:
gnuplot> plot 'foo.dat' using 1:3
gnuplot> plot 'foo.dat' us 1:4
You can also change the color and style of the line that is plotted.
gnuplot> plot 'foo.dat' w l plot using lines
gnuplot> plot 'foo.dat' w p plot using points (default)
gnuplot> plot 'foo.dat' w i plot using impluses
gnuplot> plot 'foo.dat' us 1:3:4 w yerrorbars plot 1 vs. 3 with 4 as the errorbar
You can see lots more exmaples by typing
gnuplot> help plot
and looking at the various subtopics.
Other commands
You can now plot and fit data. This introduction is only a minimal amount of the things you can do with gnuplot, and I suggest that you read the help information thoroughly. By typing help at the prompt, you will be shown a wealth of information.
The most important command
other than plot and help is set. Set controls most of the way you will interact
with gnuplot. If you type set at the prompt,
you will see most of the information that
is contained within gnuplot's help system.
gnuplot> help set
You could output your data as postscript using
gnuplot> set term post eps
or as a png file using
gnuplot> set term png.
You then give your output an appropriate file name (say for the png file)
gnuplot> set output "graph.png"
and then replot again. You can view png files using display or postscript
files using ghostscript.
Now we must reset the term and the output
back to x11, which is accomplished by re-typing the commands
gnuplot> set term x11
gnuplot> set output
The output is left empty as to not confuse things.